
Storm Notes
Need to get up-to-speed quickly on the basics of Apache Storm? This quick post will give you everything you need to know to speak somewhat competently about Storm. You'll learn the general architecture, terms, proper use cases, and basic administration and performance management.
This post will teach you the basics of Apache Storm in less than 5 minutes. From "What is Storm and What is it good for?" to "How do I monitor Storm  performance?" this post will get you up-to-speed quickly.
You may be asking, "I have no intention to use Storm or hadoop, I'm a data architect, why should I know this?". Quite simply, if you have "data" anywhere within your job title it behooves you to have at least a cursory understanding of any technology that claims to process "data". It's your job.
Storm is to real-time processing what Hadoop is to batch processing. It's similar to real-time, streaming ETL. There's even a Data Flow UI that looks similar to SSIS. Hadoop runs potentially long-running batch jobs, sometimes in MapReduce, that will eventually end. Storm provides real-time trend processing of endless stream-based data that is designed to run until it is manually stopped. Storm provides guaranteed message processing, which means that every message that enters the Storm topology will be processed at least once.
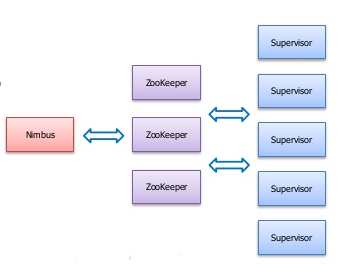
General Architecture
- Usually installed as a cluster of processing nodes.
- Nimbus node is the "leader" node
- Supervisor nodes are the workers.
Use Cases
- Realtime ETL
- Processing streams of data from devices/machine-generated data. Statuses, logs, etc
- Processing lots of data from say, clickstreams
Important Terms
- Tuple: the basic unit of data. This can thought of as a "row" or even a "document" in couchbase terms.
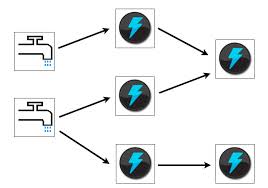 Topology: a directed acyclic graph (the graphic to the right). Essentially this is a workflow of tasks. If you think of your SSIS "control flow", this is roughly equivalent to an Apache topology. You can have many topologies on your Storm cluster just like you can have multiple SSIS packages.
 - Stream: unbounded sequence of tuples that can be processed in parallel. Think of this as the rows flowing through your data pump task or topology.
- Spout: the source of the tuples. This is usually an Apache Kafka topic (see my [[Kafka Notes]] blog post to learn more), which is similar to a queue. The spout is the topic consumer. Spouts are graphically near the left of the topology diagram.
- Bolt: a piece of code that performs calculations on the tuples. this is similar to a task in SSIS and is usually a .jar file but it can be written in just about any programming language. After processing, the bolt sends the tuples to either the next bolt in the topology, else it is an...
- Exit Bolt: The final bolt(s) in a topology. This is usually some kind of persistence engine such as HDFS, Vertica, Couchbase, etc.
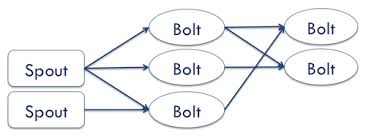
(another graphical representation of a topology. Looks a lot like an ETL workflow doesn't it?)
Nimbus Node
- master process that handles all coordination amongst nodes.
- There is one and only one nimbus node at a time.
- Nimbus handles the monitoring and distribution of code and tasks to the slave nodes.
- It's configuration data is stored in Zookeeper (zk is a kind of distributed configuration management system used in large Hadoop clusters)
- It is designed to fail-fast, meaning that when Nimbus dies it can be restarted without having any effects on the already running tasks on the workers.
 Nimbus seems like a single point of failure, but isn't. Slaves continue processing without a nimbus node, they simply will not get any code updates and will not know if their configurations have changed until a nimbus comes back online. This isn't usually a huge problem.
Zookeeper
- zookeeper is a distributed configuration management system. It is not specific to Storm or even hadoop.
- When you have hadoop clusters of thousands of nodes you need a way to centrally manage them. zk provides that service.
- zookeeper itself runs as a cluster, known as an ensemble.
- ensemble nodes do not need to be dedicated to zk. zk nodes are lightweight and can have shared responsibilities with other nodes in your larger hadoop cluster
- an ensemble should always be at least 3 nodes
- an ensemble should always be an odd number of nodes because at least half of the ensemble nodes must be up.
- There is one "leader" node, the remainder are "follower" nodes. All writes go to the "leader". Reads can go to any node. The leader, therefore, may be write-intensive based on your use case so you should plan accordingly.
- If the leader dies an election is held to promote a follower.
- zoo.cfg is the zk configuration file
- storm.yaml is the storm configuration file, managed by zk.
Supervisor/Worker Nodes
- Slave processes are called supervisors.
- Each supervisor node runs a supervisor daemon that is responsible for creating, starting, and stopping worker processes to execute the tasks assigned to that node.
- fail fast. Can be restarted without any loss-of-state since configuration is kept in Zookeeper.
- A single supervisor daemon normally handles multiple worker processes running on the machine.
Integration with Kafka
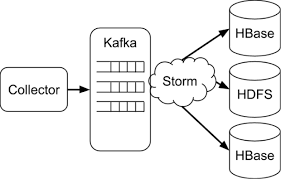 In theory, data loss should only be possible at the spout. Why? Let's say a single producer writes directly to the spout but the producer sends ore data than the spout/topology can process.
 - Since we don't want data loss producers tend not to write directly to spouts. Instead producers write to a queue, and that is general an Apache Kafka topic. Please see my post [[Kafka Notes]] if you want to learn more about Apache Kafka.
- The spout then uses the Kafka topic/queue as its data source.
- This decouples the Storm topology from the producer/collector code and allows for better architecture resiliency.
Trident
- pure Apache Storm is stateless...meaning each tuple does not maintain any transient data between bolts without some kind of persistence mechanism like Couchbase (see my post [[Couchbase Notes]] for more details), Cassandra, or, god-forbid, a RDBMS. All of this significantly slows down Storm which is supposed to be a realtime event-processing engine.
- pure Storm ensures that each tuple/each kafka message is processed "at least" once. This freaks people out who are accustomed to "transactional" systems. Remember, a typical use case is similar to "click stream analysis". In that case, if there is a network hiccup, or something similar, it isn't crucial if a tuple/event is processed twice accidentally since we aren't looking for hard, accurate numbers...we are looking for trends.
- Trident adds "state" and transactional properties to your topology.
- guarantees that every tuple entering storm is processed EXACTLY ONCE.
- this is accomplished by managing state across bolts using in-memory structures, or something heavier like memcache or cassandra
- so, if Storm is "event-streaming"...adding Trident makes the topology more like "micro-batching".
- this does add some small amount of latency.
- In a Trident topology a bolt is replaced with higher-level semantics such as joins, functions, filters, and aggregates. (This still sounds a lot like ETL processing where the final step is SSAS cube recalculation, doesn't it? And Trident is merely ensuring that the entire ETL workflow is "transactional". See, Storm isn't that complicated, is it?)
- This also provides ordering to your tuples if needed.
Let's See Storm in Action
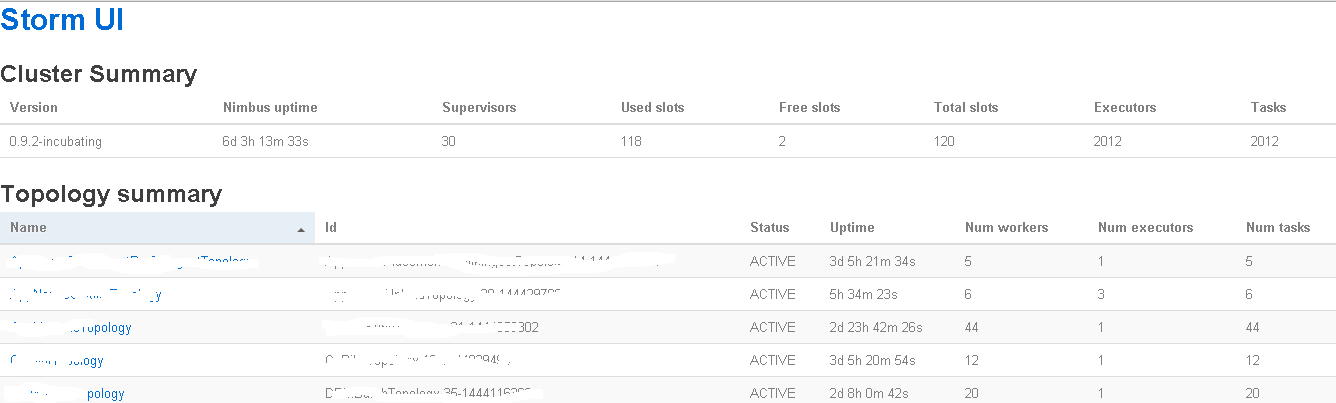
This is the basic StormUI. You connect by pointing your browser to nimbusnode:8080. Note, you see basic overview information as well as each topology and some of its high-level stats.
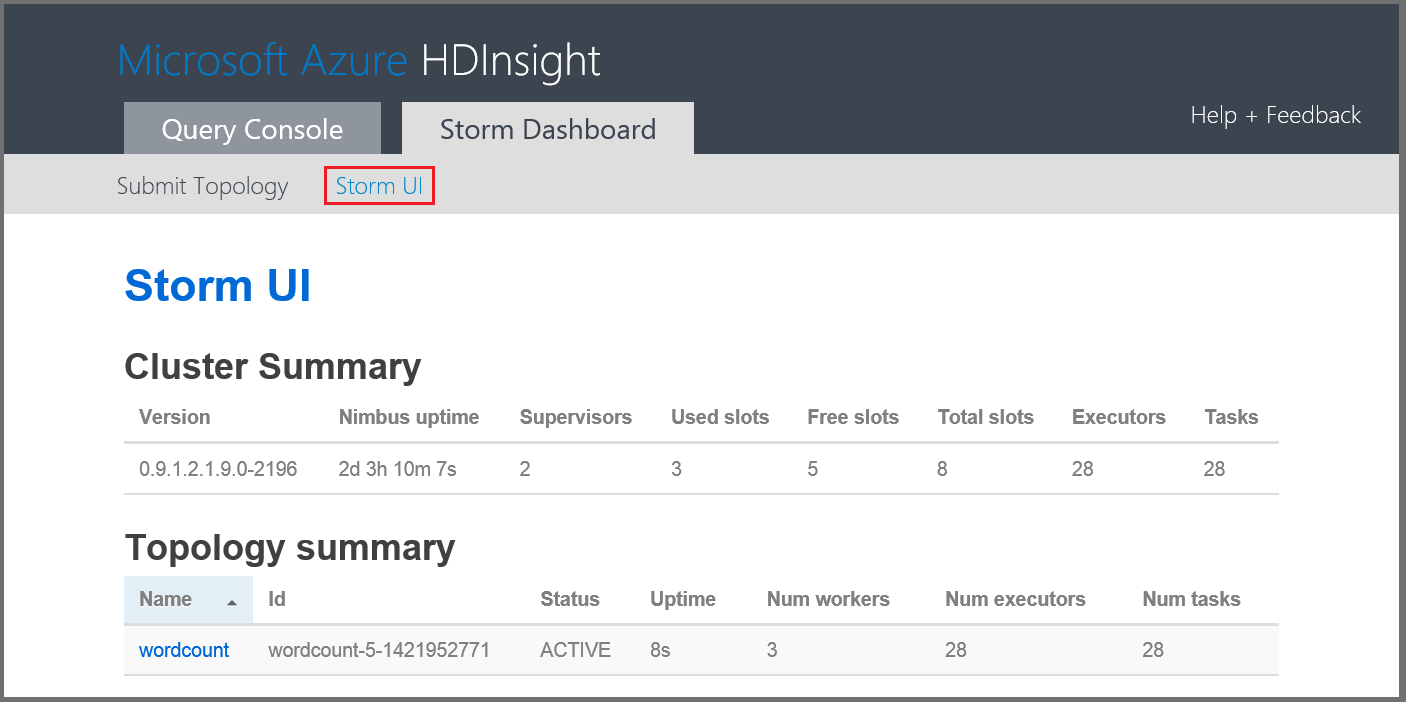
Note, if you are running on Azure it looks VERY similar:
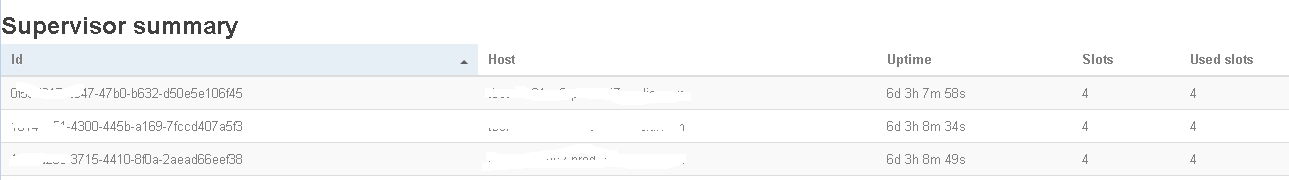
Near the bottom of the stormui homepage you'll see the node summaries...aka the supervisors. "Slots" is the number of workers that a node can run and "Used slots" indicates how many of those are configured to run topologies.
From the home page we can drill in to any given topology and are presented with this screen:
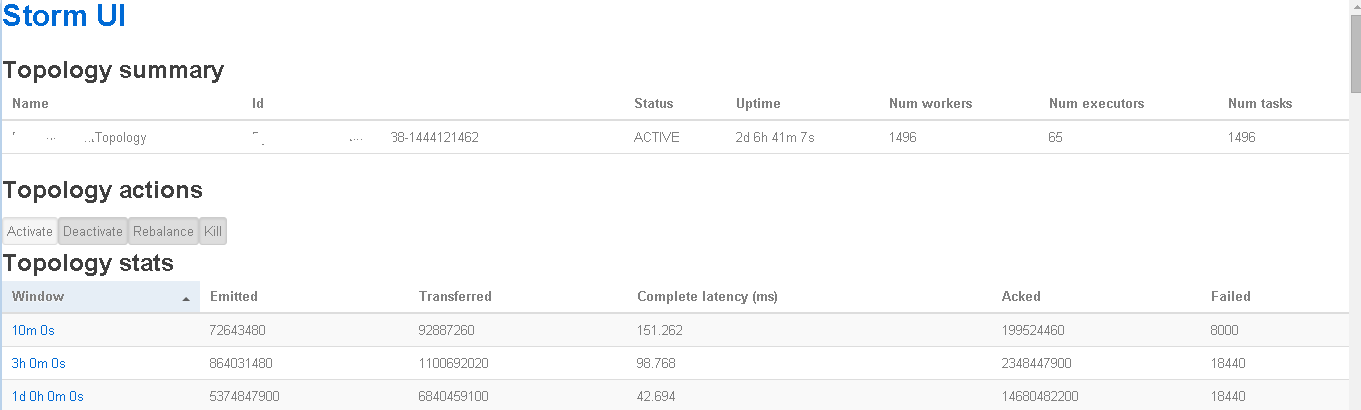
Lots of valuable information here. I find "Topology stats" to be invaluable. Here you quickly see your performance metrics from the last 10 minutes to the last day. You can also quickly see if load has picked up, if latency suddenly spiked, and if failures are creeping up. This is really valuable info and I love how the UI designers gave us all of this valuable info in one compact screen.
Near the bottom of that screen you'll see this:
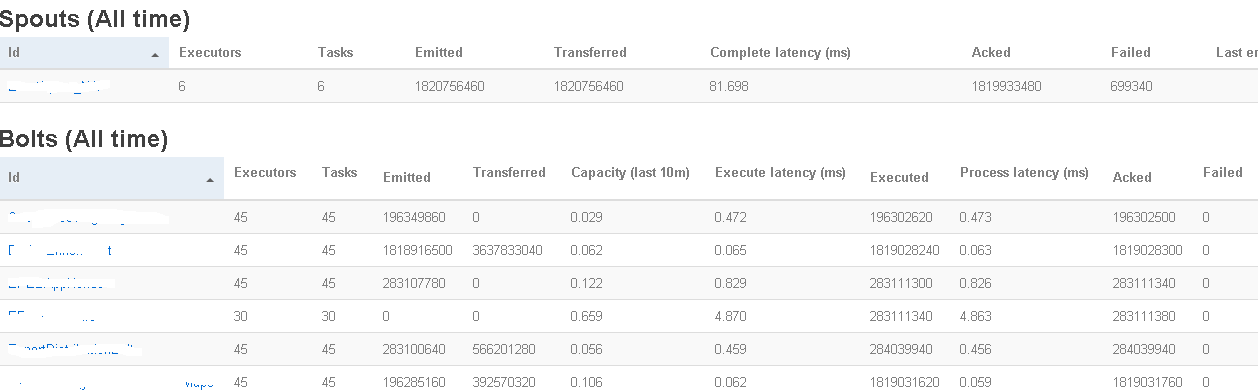
This is showing you how many tuples were "emitted" by the spout as well as the complete latency to process a tuple. I've found latency is the most important metric when monitoring real-time stream data. I need the latency low enough to process the spout data realtime without bottlenecking.
Let's say your latency has grown or your topology can't keep up with the ever-increasing spout traffic. How do we know which bolt we need to optimize? The "Bolts (All time)" shows you the latency for every bolt. Basically, find the latency that is the highest and begin there.
You have just read "[[Storm Notes]]" on davewentzel.com. If you found this useful please feel free to subscribe to the RSS feed.

Dave Wentzel CONTENT
nosql hadoop