
Introduction to the MySQL Performance Schema
If you are new to performance troubleshooting with MySQL, specifically using the performance_schema, then this post is for you. If you are an "accidental DBA" for MySQL, and you need to quickly fix some performance problems, then read on. This post will give you example queries and background to get your MySQL performance problems solved quickly.
If you are an "accidental MySQL DBA" and you are having performance problems, this post will show you how to use the performance_schema to quickly  diagnose where your performance problems lie. The performance_schema uses instrumentation points within the mysql binaries to perform latency and wait analysis. This is really no different than MSSQLServer's DMVs or Oracle's v$ views. This post won't teach you everything you need to know about maintaining a good-performing MySQL instance, but it will give you a quick overview to get you started.
Overview
The performance_schema (ps for the remainder of this post) is the "modern" way of instrumenting MySQL to get performance measurements. ps exposes data collected by "instrumentation points" placed in the MySQL code. By tracing SQL statements you can drill in and determine why a SQL statement is performing poorly by looking at where the "wait" resides in the instrumented code.
performance_schema, by default, only instruments at the "higher" levels so you can't see where the waits reside at a low-level, for instance the wait may be due to page splits. However, I'll show you where you can dial up the instrumentation to get you low-level details.
performance_schema is a schema/database within modern (5.5 and later) mysql instances. ps has its own storage engine where most counters are not persisted to disk in real-time so there is less likelihood of ps monitoring itself causing perf problems under load. (SHOW ENGINE performance_schema STATUS). Configurations survive service restarts but the counter data does not. This works identically to how MS DMVs work.
Performance Schema Objects
ps is a schema/database that is installed and minimally configured on your MySQL instance. You will mostly use the tables in the performance_schema database/schema to do most of your research.
- tables prefixed with setup_ are setup-related tables. Using these tables you can tell ps what to instrument and at what level of detail.
- tables suffixed with _current will show you metrics on currently-executing statements. Table contents tend to be transient with _current tables.
- tables suffixed with _history show you metrics over time for the given subject area.
If any of the tables mentioned have no data and you believe they should that means that the given instrument is not enabled. Look at your setup_ table configurations.
performance_schema Setup
By default ps instruments SQL statements for wallclock durations and rowcounts. However, you'll likely want to enable deeper monitoring.
Many blog posts have been written on this and enabling the lower-level instrumentation only adds a negligible overhead to your system.
use performance_schema;
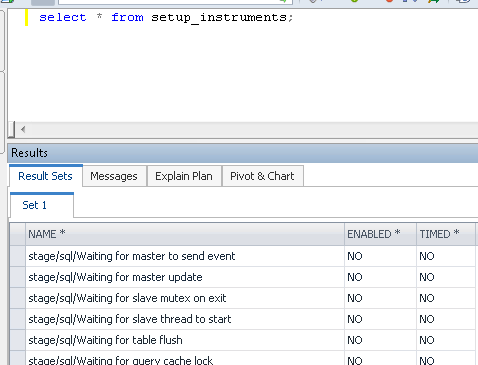
select * from setup_instruments where enabled = 'YES'; -- shows you what is currently enabled in instrumentation
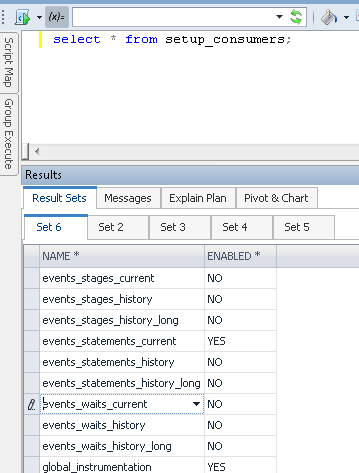
select * from setup_consumers; -- which consumers are enabled
-- items that really should be enabled but probably are not
 -- events_statements_history should be enabled
 update setup_consumers set Enabled = 'YES' where name = 'events_statements_history' LIMIT 1;
 commit;
Examples of Consumers
Examples of Instruments
My recommendation is to turn on all monitors for stage events. This contains most of the lighter-weight instruments and isn't too costly on performance.
update performance_schema.setup_instruments set enabled='YES', timed='YES' where ... ;
commit;
-- for the consumers you probably want at least events_statements_history
 update performance_schema.setup_consumers set enabled='YES' where ...;
 commit;
-- additional setup options to investigate, if needed
 -- setup
 select * from performance_schema.setup_instruments; -- TIMED and ENABLED should both be YES
 select * from performance_schema.setup_actors;
 select * from performance_schema.setup_objects;
 select * from performance_schema.setup_consumers;
Regardless of the options you choose, global_instrumentation and thread_instrumentation must always be YES. "_current" instruments must be enabled for "_history" and "_history_long" to work also. This should be common sense if you think about it.
Additional performance_schema add-ons mysql sys: https://github.com/MarkLeith/mysql-sys : extensions to the performance_schema. Additional queries, views, functions that build on ps.
I also have a series of scripts that I use that are very similar to my PerformanceCollector tool, but are obviously written specifically for MySQL.
Helpful scripts in my repo:
- truncate_monitoring_tables.sql : this script resets the counter tables. This is valuable:
- after a new software release to reset the monitors
- before a load test to reset the monitors.
- Otherwise the monitors are cumulative until the next restart of MySQL. performance_schema configurations survive restarts but the counters do not.
- additional_helper_objects.sql : additional views to ease analysis
- queries_current_status.sql : queries to show you what is happening right NOW. Also good to run at intervals during load tests
- queries_history_by_queries.sql: historical information for SQL statements
- queries_history_by_waits.sql : historical information by waits
- queries_history_data.sql: other history queries, mostly involving latency detection
- queries_memory.sql: historical queries showing memory utilization
- queries_tables.sql: historical data for table objects
Summary
By no means an exhaustive writeup on MySQL's performance_schema, this post is an introduction to basic performanc troubleshooting for the accidental MySQL DBA. This will give you just enough information to be able to perform informed google searches to help you track down your MySQL issues. Good luck.
You have just read "[[Introduction to the MySQL Performance Schema]]" on davewentzel.com. If you found this useful please feel free to subscribe to the RSS feed. 
Dave Wentzel CONTENT
mysql performance