
PerformanceCollector.BlockAndWaitMonitor
This is Part 3 of my blog series on PerformanceCollector. This utility will help you monitor and baseline the performance of your SQL Server. You can download the source code here. It is totally open source and there is no copyright. It follows the Oracle YAPP method of performance monitoring where we monitor our response times and try to improve them by eliminating unnecessary waiting on the server. Today I am going to cover PerformanceCollector.BlockAndWaitMonitor which is a view that shows you any process that was waiting or blocking/blocked and the cause. This is snapshotted from various DMVs every 15 seconds. We maintain this data for 30 days. Both the snapshot interval and data retention settings are configurable in PerformanceCollector.Config.
The Typical Use Case
In general people will complain about application performance by saying, "The app was slow from 1:45 to 2:00 today. Can you look at the database?" In that case start by querying this view and filtering where CurrTime BETWEEN '1:45' and '2:00'.
You are looking for:
- any blocking/blocked spids
- any spids waiting and what they are waiting on.
- sql statements/procedures with longer durations than normal (may be missing an index or stats need to be updated).
There are infinitely more things to look for that I can't possibly cover in a short blog post. Experience and google are your friends here. You'll likely find the cause of the problem if you look at the data and think logically.
Baselining
It's difficult to baseline wait events and whether they are trending in the wrong direction. However, you can do basic trending by looking for "canaries in the coal mine". Every system I've ever worked on has had patterns of performance behavior that, when observed, were good indicators that your users were unhappy with performance. An example is lock escalations. When a given query is running in READ COMMITTED isolation and scans an index it runs the risk of locking the entire data structure because the fine-grained row locks are escalated to table locks to conserve resources. When this happens lots of spids tend to be blocked behind the lock escalating spid. When the lock escalating spid runs for more than a few seconds users will think your database is down. So, this is a use case I baseline. It is fuzzy logic but we know to react to these event chains quickly before the calls start coming in.
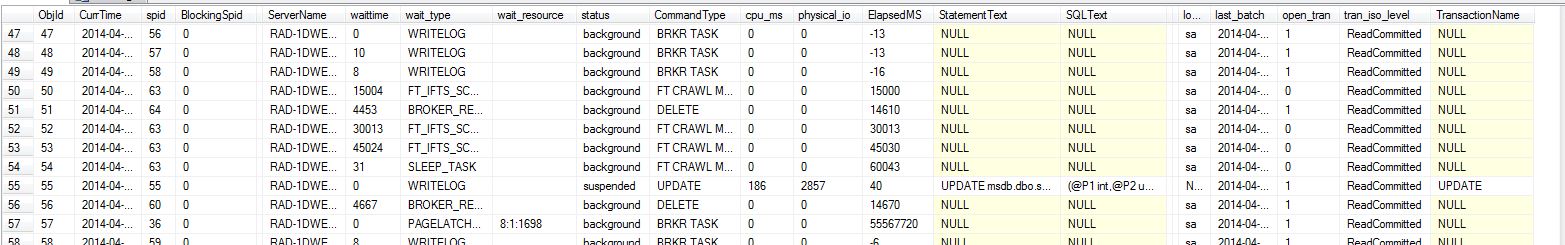
(sample output from PerformanceCollector.BlockAndWaitMonitor)
Manually Capturing a Spid
You can manually run EXEC PerformanceCollector.WaitAndBlockInspector at any time and it will log current waiting and blocking data. This may be useful if you notice your query is taking longer than it should. You can also pass a @spid parameter like this EXEC PerformanceCollector.WaitAndBlockInspector @spid = 100; and it will show you any waiting and blocking as well as any activity for the spid. This data is output to the screen and logged in the table.
Abandoned Spid Handling
BlockAndWaitMonitor will also show "abandoned spids." An abandoned spid is any spid with an open transaction for at least 60 seconds that is blocking something else. Here is the most important aspect...the spid must be sitting on AWAITING COMMAND. That is what differentiates an abandoned spid from an ordinary, run-of-the-mill blocking spid. When the spid is sitting on AWAITING COMMAND that means the SQL Server is waiting for another command from the spid to do something...most likely issue a COMMIT TRAN.
I have never seen a case where the spid will come back and issue the COMMIT. Hopefully your developers are smart enough that they don't allow user input while a database transaction is open. In every case an abandoned spid occurs because a data access framework thinks it is NOT in implicit_transaction mode and SQL Server thinks it is. For instance, various combinations of jdbc and websphere produce this behavior because jdbc does not issue sp_reset_connection commands like .NET does.
An abandoned spid is first logged after 60 seconds. After 5 minutes of being in an abandoned state, and after another spid has been blocked by it for 60 seconds, the spid is killed. It is logged to PerformanceCollector.SpidsKilled.
You can of course disable this feature in PerformanceCollector.Config.
Summary
BlockAndWaitMonitor is the most important aspect of the PerformanceCollector tool. It will show you how the SQL Server subsystems (IO, Memory, lock manager, log manager, etc) are contributing to "waiting" on your SQL Server. You will see more than just the SQL command that is blocking...you'll see an approximation of why it is blocking. This is important. Just because a procedure is long-running does not mean a new index will fix it, nor will a rewrite either. You have to understand why it is behaving like it is and which subsystem is contributing. Only then will you know what needs to be fixed.
In the next post I'll cover some of the other features of Performance Collector.
You have just read "PerformanceCollector.BlockAndWaitMonitor" on davewentzel.com. If you found this useful please feel free to subscribe to the RSS feed. 
Dave Wentzel CONTENT
sql server performancecollector performance