

Data-Driven Customer Lifetime Value
Business is changing and the customer is the focal point now more than ever. Customers understand they have access to greater choices than they did 20 years ago. If they don’t like some aspect of your offering they will take their business elsewhere. So now businesses are fighting for a greater share of the TAM (Total Addressable Market), trying to grow the customer base. Smart companies also have an eye toward customer retention. In the past, decisions around customer acquisition and retention were done by intuition. Forward-thinking executives are using better data and analytics to guide these decisions. To do that, good metrics are needed and one of those is Customer Lifetime Value (usually abbreviated CLV, or sometimes LTV). In this article I’ll show you how the Microsoft Technology Center (MTC) decision architects help customers with thorny analytics problems like CLV. I’ll show you different approaches and definitions of CLV so you can confidently start a customer-driven analytics project.
The Business Problem
Customer Lifetime Value is a simple metric based on math.
Conceptually, CLV has been around for years but most companies didn’t have all of the necessary input data to create a trustworthy CLV number. That’s changing, but I still find most of my customers don’t have all of the data they would like to have (especially around customer behavioral data) to have a more accurate CLV metric. Don’t let that frighten you. It’s ok to publish a CLV number that is a work-in-progress.
Don’t let the “perfect” be the enemy of the “good enough”.
CLV works in conjunction with other “customer value” metrics like CAC (customer acquisition cost). So what’s CAC? If you offer introductory promotions or leverage loss leader (described below) to attract new customers, you need to understand how much that will affect profits over time . How much money can you lose, and for how long, based on how much revenue you think the customer will generate over the customer lifecycle? Some examples:
- introductory low/no fee credit card offers. Finance companies will take an initial loss because they know this is profitable over the lifetime of the customer.
- Printer manufacturers sell printers at a loss because they know more profits can be made in ink cartridges over the printer’s lifetime than can be made on the printer itself.
CLV can be used to determine what a reasonable CAC should be. An aggressive marketing campaign that substantially raises CAC might not be financially sustainable if the CLV doesn’t also increase. Again, in the past, this balancing act was done by gut instincts. Even with an imperfect model we can now look at CAC and CLV in a more quantifiable manner.
If your product is a “one time purchase” item (think long-lived capital purchases like washing machines) then the CLV may be that one-time purchase. But, if your product is a subscription or is repeatedly purchased (think razor blades) then each subsequent purchase event adds to the revenue over the customer’s lifetime, which means that an additional CAC investment might be warranted.
The above is a gross over-simplification. Some long-lived product-based companies, like those in the automotive industry, take different approaches to CLV and CAC. Luxury automobile makers value CLV much higher than economy car makers. They understand they are selling an aspirational experience and the satisfied customer will be a repeat buyer, possibly over DECADES. The TAM for luxury autos is smaller than economy cars and they can’t afford the churn. Economy car makers have a higher TAM and aren’t as concerned with CLV and brand loyalty (because there usually isn’t any). Based on how you are treated when you walk into a dealership is indicative of the value they place in repeat business.
Each of your customers may have a different CLV (and CAC). Sometimes companies try to generate a unique CLV for each and every customer. That can certainly work, but it’s usually better to create customer segments and apply a CLV calculation to each segment. Each segment may have different loyalties and profit profiles. Customer segmentation is beyond the scope of this article but let’s just say that something called “unsupervised machine learning” has been proven invaluable in creating very accurate segments given a series of data inputs.

Retaining customers has a cost too. Customer churn occurs when customers take their business elsewhere. The naïve reaction is to retain all existing customers as long as the retention costs are less than the CLV. Well, maybe. In the past a low churn rate was the goal. Today, that is changing and businesses are considering intangibles like on-going support for deprecated products and the expectation of on-going discounts in their decisions to “fire their customer”. Likewise, some customer segments will always be “one-time buyers”. If these customers generate razor-thin margins, wouldn’t it be better to allow them to churn if we can replace them with customers with higher CLVs?
The CLV Calculation
Here’s the thing, there is no standard, generally-recognized calculation for CLV. It will be different for every industry and every business, based on the weightings that are important to them. Similarly, the calculation can change over time as you learn new things about your business model and customer mix.
To be fully transparent, most CRMs will provide you with “their” CLV calculation. Be skeptical. Their formula is usually opaque. They market it as “value-added AI” as an up-sell. CLV shouldn’t be a black box AI model. You need visibility to tweak it. Next, a good CLV will take a lot of (if available) behavioral data into consideration. Your CRM won’t have access to that data. Remember that the more data YOU can gather about your customers will aid in not just a better CLV metric, but a better understanding of your customers.
It’s always best to start out with a simple CLV calculation using the “historical sales” approach (using our existing data as our guide). No need to boil the ocean. It starts with revenue estimation. Here’s the process:
- Step 1: What is the average revenue per purchase? This is fairly easy to do using your existing sales data. This can get tricky, quickly. How much historical data should you look at? If you have purchase data for that last 30 years, should you really be using it? Are the sales patterns from even 5 years ago relevant today?
- Step 2: What is the frequency of purchases? Every industry and company is different, but think about the purchase cycle of your customer. Let’s say you sell printers and ink. A good purchase cycle might be 3 years, assuming a new printer is purchased every 3 years. Within that 3 years a customer may make 3-5 ink purchases per year. If you are a convenience store the purchase cycle could be one week with purchase frequency of 3-5 days/week (if your customer is a daily commuter that needs a morning coffee fix). If you follow a subscription-based business model this is much easier to calculate since the recurring revenues are easier to predict. (This is why every business is trying to determine how to stop selling capital goods and move to a recurring revenue model).
- Step 3: Avg Revenue per Purchase x Purchase Frequency: this gives you the revenue over the purchase cycle period.
All of the above numbers we can gather from our existing sales databases and apply some simple math. Nothing controversial.
Now it starts to get a little qualitative.
- Step 4: Calculate “Customer Lifetime”. How long does your average customer continue to do business with you? If the bulk of your customers are “one-time purchasers” then the answer is simple. If your customer stays with you for 10 years, on average, then that is much different. The “lifetime” can become contentious but with some creative thinking we can generally agree on a good lifetime metric. The lifetime metric can change over time with changes in your business model and industry. Think of the cable TV industry. 20 years ago no one was predicting “cord cutting” and the industry bet heavily in “bundling” your TV with your phone and internet. Today, phone service is something many households are foregoing. A landline customer’s lifetime was historically calculated in DECADES…today it’s substantially shorter…and getting shorter every day.
- Step 5: Purchase Cycle Revenue X Lifetime: this gives you the basic CLV

Let’s look at an example: Let’s say you run a convenience store and we want to determine the CLV for our morning commuters. Feel free to adjust my assumptions:
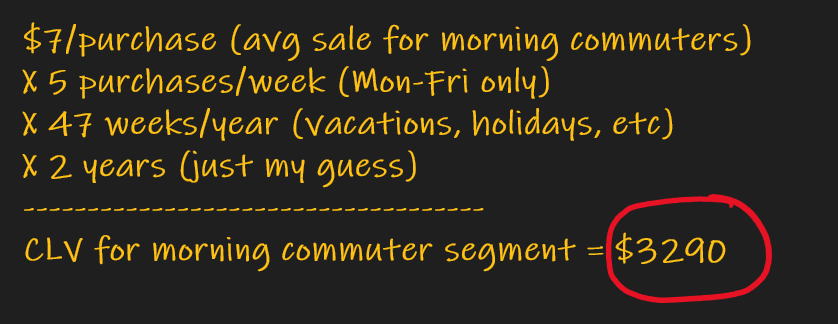
That’s the basics.
Now we need to get more advanced in our calculations.
First, segment your customers. Instead of averaging all of your customer’s together to determine revenue per purchase, try segmenting your customers. I’ll cover customer segmentation in another article but let’s just say that segmenting your customers is often a qualitative endeavor. Each “cohort” is designed based on what you think is important. Does gender affect purchasing decisions? If so, that would be a cohort. Or you could segment by geography, avg revenue size, transaction date…basically, whatever you think makes up a good cohort. This is where we can begin to really customize CLV for our purposes.
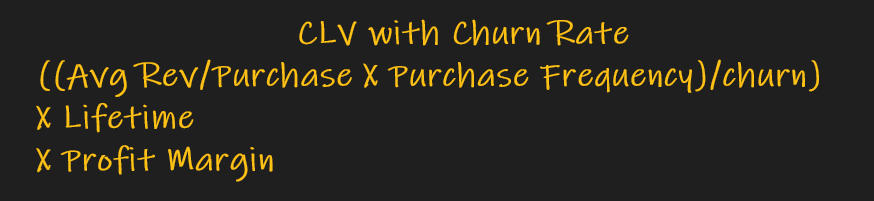
Second, determine the profit margin. Should you be basing CLV on revenue (sales income BEFORE expenses…aka the top line) or profit (income after expenses…aka the bottom line)? Some companies want to see CLV based on revenue, some on profits. There are pros and cons to each. Revenue-based CLV isn’t affected by changes in costs. If you decide you want a profit-based CLV then just determine your profit margin and multiply the existing CLV by it.
In theory, without factoring in the profit margin we have really just calculated CLR (customer lifetime revenue). The “value” in “CLV” really should be factoring in costs at this point, but everyone has a different opinion on this.
How do you calculate the profit margin?

Remember, the profit margin may be different for each product you offer…you should start to see how the CLV calculation is getting more complex.
But, to keep it simple, here is our updated CLV formula:

Next, churn rate is a factor. If 20% of your customers “churn” during a given purchase cycle, well…we need to know that. You might be able to determine the churn rate by looking at your existing sales data if it is available for longer time periods.
The new formula:
That’s the basic CLV calculation using historical data. There are a few things we can do to make the calculation a bit more advanced:
- determine the discount rate. This is wonky but in economics there is a time preference of money…money “in pocket” today is worth more than that same amount of money in the future. The future has unknowns (including inflation) and tomorrow’s revenue streams cannot be guaranteed. The discount rate is a simple percentage that has a much larger impact on CLV if the lifetime is measured in decades rather than years. In finance terms, the discount rate gives use the NPV of future cash flows.
- use probabilistic modeling. Using probabilities we can apply better estimates to each transaction’s monetary value and transaction count. We can build RFM models to help (again, too much for this article). This is fairly complex and something you can research on your own…just note that a good data scientist will know how to do this and there are python packages that can help to simplify the math. In data science lingo we are further “featurizing” the data…meaning we are transforming the data from raw numbers to something that is more valuable.
Machine Learning Approaches
A good data scientist can look at all of the input data mentioned above and build a model algorithm that determines CLV by fitting regression curves to the historical data.
But, we can really do that ourselves in Excel without ML. Where ML shines is we can add additional data points which would be difficult to model in a straight equation, allowing the ML algorithm to determine the weightings for each of these inputs based on historical data. Examples:
- behavioral data: Companies use sentiment analysis against social media to determine if a customer is a churn risk. What else can you think of that can be used to model your customer’s behaviors?
- external data: Any dataset that helps you understand your customers better can be used as a feature in an ML model. Credit scores, credit card transaction histories, product return histories, call center metrics…use your imagination
- browsing history/cookies: Yep, we can determine which customers “look like” our most profitable customer segments and use ML to determine who we should focus on.
- inventory value. In every industry, inventory carry has a cost. The less inventory we need to warehouse, the better. Inventory fluctuates over time and that will affect cost, which will affect profit, which will impact CLV.
- anything else that affects the quality of the input variables. What else can you think of that would be important to you?
Why is CLV so important?
Here are some reasons why this calculation is so important:
- We need to focus our customer retention and acquisition efforts on our most profitable customers. CLV on customer segments is how we do this quantitatively vs instinctively.
- Businesses usually assume that customer loyalty and retention are important. After calculating CLV you might find you are incentivizing your worst customers to be loyal when you should be focusing your energy on attracting new customers.
- Who do we market to and how can we structure those campaigns? Just because we’ve used CLV to determine our most profitable customers doesn’t mean it is cost-effective to market to them.
- CLV can help determine marketing campaign ROI. If we know the marketing costs over the purchase lifecycle and we can determine the number of new customers acquired over that same time period, we should be able to determine the economic success of the marketing campaign. Here’s a formula:
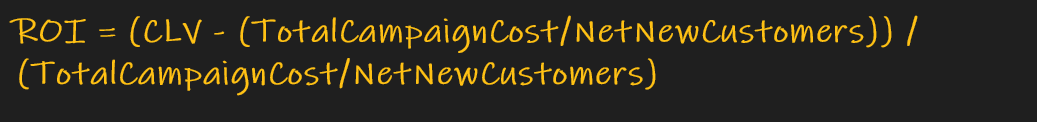
It’s easier to describe with an example:
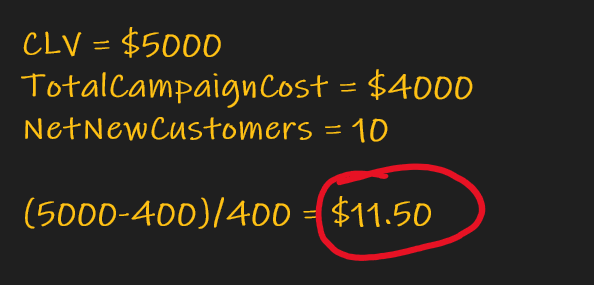
In this example the ROI is $11.50. Said differently, for every $1 spent on this campaign we generated $11.50 in profits over the lifetime of this customer.
- We can use similar math to determine if incentives, one-time-offers, introductory rates, and other tricks will actually have a positive ROI
- CLV can help justify higher CAC
- CLV can guide product development efforts. Which existing products lead to higher CLV and how can we leverage that to create more compelling offerings? We can make sales team compensation decisions based on CLV. I’ll let you use your imagination on this one.
- Should we leverage “loss leader” strategies? Loss leading is a strategy where a business sells at a loss to attract new customers in new market segments.
- Improve customer loyalty. You can use CLV to empower your customer service reps to offer refunds and credits for high-value customers. Ultimately, this drives loyalty.
How can the MTC help?
Everyone talks about “Digital Transformation”. But what is that exactly? At the Microsoft Technology Center (MTC) we believe Digital Transformation is about monetizing your data…and that simply means we are using data in new ways to make money. Customer Lifetime Value is nothing new, but historically it’s been difficult to quantify that number. The data wasn’t always available, or it wasn’t available in a timely manner. That’s no longer the case in 2021. We can do amazing things with data and compress time-to-value. What took weeks or months to do in the past can now be done in hours if we utilize tech smartly.
Are you convinced you are leveraging CLV to drive your revenue goals? Can you measure your CAC and marketing campaign ROI? We can help you.
The MTC mandate is to be the Trusted Advisor for our customers. We do that by showing how data can add business value. The tech is easy, what’s hard is understanding the processes that work. We can help your people build CLV prototypes in just a few days. We’ll work with you to think through the inputs of a CLV calculation that will add value to your business in your industry, and then help you build it. In 2021 we should be taking more “small bets” and calculated risks with our data projects versus creating months and years-long capital projects with high fail rates. Building CLV models, quickly, by leveraging the Azure Cloud, is perfect to determine if it really is different this time.
Does that sound like a good investment of your time? Contact me or your account team today.
Are you convinced your data or cloud project will be a success?
Most companies aren’t. I have lots of experience with these projects. I speak at conferences, host hackathon events, and am a prolific open source contributor. I love helping companies with Data problems. If that sounds like someone you can trust, contact me.
Thanks for reading. If you found this interesting please subscribe to my blog.
Related Posts
- Data Literacy Workshops
- Software Implementation Decision Calculus
- MTC Data Science-as-a-Service
- Top 10 Data Governance Anti-Patterns for Analytics
- The Dashboard is Dead, Probably?
Dave Wentzel CONTENT
data science Digital Transformation data architecture