
Monitoring Disk Latencies with PerformanceCollector
PerformanceCollector (PC) is free and open-source software (FOSS) that I have developed to monitor and baseline performance of your SQL Server. There are certainly plenty of commercial tools and even free scripts available on the net that handle all of this. What I like about PC is that it can be deployed with a simple PoSh call, runs without any dependencies, and is easily customizable to support any additional logging and reporting that you may need.
In the first few iterations of PC I simply logged the aggregated disk latency data by database to PerformanceCollector.IOStalls. This works pretty well until you realize that when you need the latency calculations you need to go and find them yourself. And then you have to handle "division by zero" math in all of the calculations. And since the data was aggregated by database you can't see individual drive and file metrics. I just modified PC so that these calculations are generated for you so you don't need to go and work the math in the middle of a "performance event" at 2am. I now log all of the data that you should need to both track baseline and trend IO subsystem data, as well as see the most recent disk latencies.
Why should I care about disk latencies?
The slowest component of any SQL Server is likely the IO subsystem. If the IO subsystem can't keep up with the data requests the manifestation will be perceived "slowness" by the users. However, this slowness is hard to pinpoint. Regular "waiting" events in SQL Server (like PAGEIOLATCH_EX) won't manifest. Look at it this way...there's nothing necessarily wrong with your IO subsystem, it was just sized incorrectly for your current workload.
The problem is exacerbated in that most DBAs are not given the tools and access needed to see if the IO subsystem is contributing to the perceived slowness. For instance, if you are using SAN storage then you can't really see the low-level IO metrics that you need if you really want to determine if the IO subsystem is contributing to your pain. Most SAN guys won't tell you that your LUN is on a shared spindle with 5 other Oracle databases.
Even with PerfMon when you look at physical disk metrics like Avg. Disk sec/Read and Avg. Disk sec/Write you won't see the most accurate metrics because your data may be spread out in various RAID configurations that may be masking problems. I've written about these issues in the past (see [[IOPs]] and [[Latency and IOPs]]).
The best way, as a DBA, to diagnose if your IO subsystem is contributing to "slowness" is to look at disk latency (disk sec/read, disk sec/write, disk sec/transfer) from the SQL Server metrics directly.
So, if you suspect an IO subsystem problem you need to gather whatever evidence (ammo) you can and then submit that to your admins/operators. Otherwise, they'll likely close your ticket indicating that "everything is green on the SAN." That's less than helpful.
Disk Metrics That Any DBA Can and Should Collect
Disk Latency data is the ONE METRIC that every DBA can collect and can quickly indicate if you have general IO subsystem issues. These are the latency rules-of-thumb that I live by:
| Media Type | Maximum Latency | Why? |
|---|---|---|
| Local rotational media (spinning disks attached directly to your server) | 10ms | See [[Latency and IOPs]] for more details. |
| SAN storage | 50ms | Frankly this should also be <10ms but I've never seen this in practice. There is always some overhead. |
| SSD/Fusion IO | imperceptible | SQL Server should not be able to perceive latency with solid state disks. |
Fusion IO is, very simplistically, SSD storage attached to the PCI bus instead of the SATA/SCSI bus, which makes it much faster than using just SSD alone. It means I/O doesn't need to go through the standard OS I/O drivers which were written/optimized for rotational media and are less optimal in today's age of flash memory storage.
Latency Calculations with SQL Server
SQL Server has sys.dm_io_virtual_file_stats which provides aggregated information that can help you with latency calculations. Latencies are calculated by looking at one of these formulas:
- Read latency = io_stall_read_ms / num_of_reads
- Write latency = io_stall_write_ms / num_of_writes
- Total latency = io_stall / (num_of_reads + num_of_writes)
And all of this data is available in the DMV previously mentioned. Previously in PC I was merely saving this DMV data to PerformanceCollector.IOStalls and then writing the queries by hand every time I needed to see disk latencies. Of course this requires remembering the formulas mentioned above, which isn't easy to do at 2am.
A Real-World Case Where Disk Latency Data Saved My Skin
I was a consultant for a company that had heavily invested in Fusion for their DW server. I was brought on-board to help rewrite an application that was ridiculously slow. I added a ton of missing indexes and rewrote a ton of poorly-performing queries, yet my gut told me performance should still be better, ie I perceived the system to be slow. 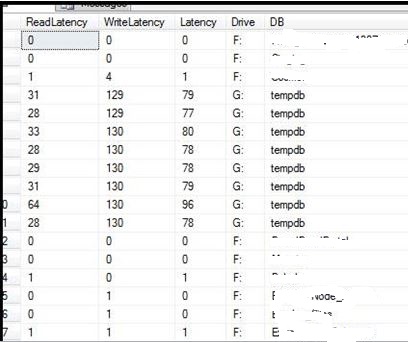
I installed PC and it showed me very little "waiting" or "blocking" or any of the other usual suspects. All I saw was a bunch of IO_COMPLETION events which usually indicate queries that spill their "temporary worktables" to disk. That was expected due to the nature of the DW workload. But should that really be happening on Fusion? Shouldn't Fusion be able to keep up with the spills?
I asked the DBAs and OS engineers to confirm that there were no hardware "alarms" indicating issues with the IO subsystem. They quickly replied, "everything is green on our end."
I retorted, "I see these IO_COMPLETION waits that I really don't think I should be seeing on a system with Fusion, are you sure the Fusion stuff is set up correctly?"
"Yep, everything is green here."
Being a skeptic, I queried PerformanceCollector.IOStalls and added the necessary calculations to the raw data to see the disk latencies. Please see the graphic to the left.
Essentially the latencies look awesome for the F drive where the user databases live...exactly what I would expect. But look at the G drive, where tempdb lives. Those latencies are terrible and are NOT the latencies I would expect to see from properly configured Fusion. Those latencies are more reflective of rotational SAN media.
So I continued to query the Ops folks, "Guys, the latencies for tempdb (and G drive in general) are terrible. Are you sure tempdb is on fusion? It can't be. Whenever you have fusion available to you you should always consider putting tempdb on those drives FIRST."
"Um, oh, it looks like when we built the server we left tempdb on the SAN instead of fusion. We got it wrong. We'll fix it."
They did and since then the IO_COMPLETION waits have disappeared and my application is perceived to be at least 3x faster.
Summary
IO stalls and disk latency data is not something that you need to worry about in your daily SQL Server performance tuning. But when you run into situations where you honestly believe your IO subsystem is not keeping up with the workload, and you believe it should, then disk latencies are the best way, from a DBA perspective to get the ammo you need to prove there is a problem.
PerformanceCollector has a table that logs IO stalls (disk latencies). In previous PC versions I aggregated the raw data by database which means some of the data fidelity is lost. In this release I maintain both the raw data and the actual latency calculated data so you no longer have to handle writing the calculations yourself. This data is also helpful for general baselining of your IO subsystem.
You can download PerformanceCollector here
You have just read "[[Monitoring Disk Latencies with PerformanceCollector]]" on davewentzel.com. If you found this useful please feel free to subscribe to the RSS feed. 
Dave Wentzel CONTENT
performancecollector performance sql server